Imputation with Ordered-categorical Data and a Saturated Model
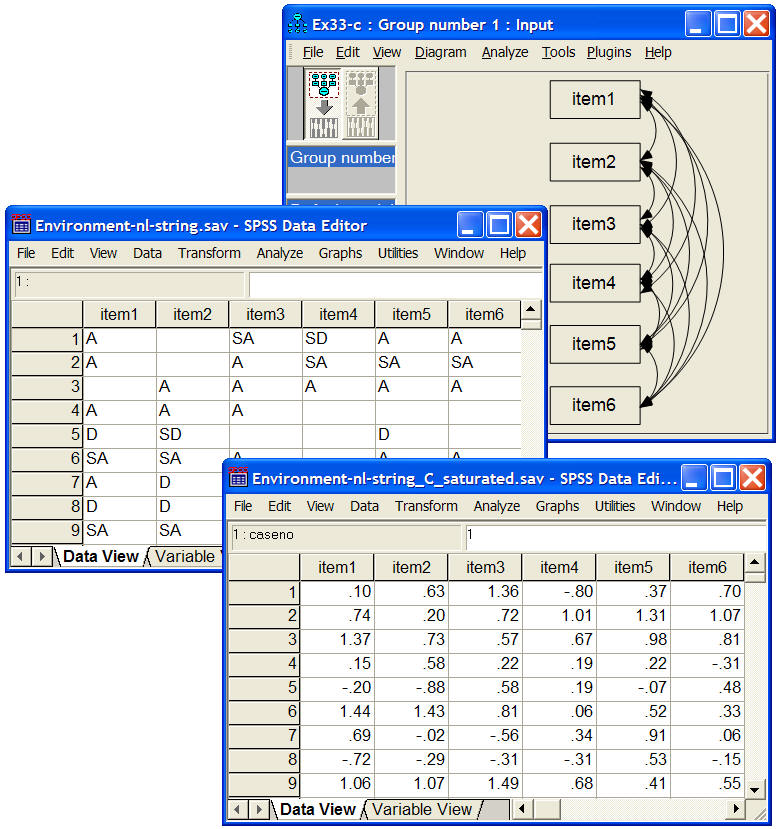
The following three screenshots show
- a path diagram of a saturated model for six ordered-categorical variables.
- an original dataset (before imputation) of ordered-categorical data, where some measurements are missing.
- a completed dataset (after imputation) that contains filled-in numeric values for ordered categorical values and for missing values.