IBM® SPSS® Amos™ 28
 opens a window that plots the posterior distribution of estimands that are selected in the table of the Additional Estimands window.
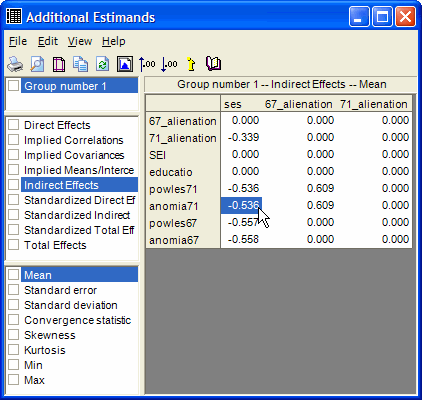
Click  before selecting the estimands whose posterior you want to plot. If you hold down the control key and select two estimands, you will get a plot of their marginal bivariate distribution.
In the following figure, the posterior distribution of the indirect effect of ses on anomia71 will be plotted.
