IBM® SPSS® Amos™ 28
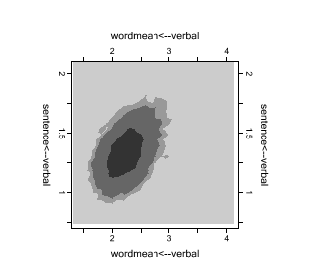
Selecting Contour displays a two-dimensional plot of the marginal posterior density of two estimands, for example:

Ranging from dark to light, the three shades of gray represent 50%, 90%, and 95% credible regions, respectively. A bivariate credible region is conceptually similar to a bivariate confidence region that is familiar to most data analysts acquainted with classical statistical inference methods.