IBM® SPSS® Amos™ 28
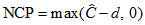 is an estimate of the noncentrality parameter,
  .
.
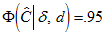
The columns labeled LO 90 and HI 90 contain the lower limit ( ) and upper limit (
 ) of a 90% confidence interval for
  . is obtained by solving
for , and is obtained by solving
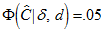
for , where  is the distribution function of the noncentral chi-squared distribution with noncentrality parameter and d degrees of freedom.
Use the \ncp text macro to display NCP on a path diagram. Use \ncplo and \ncphi to display the lower and upper limits of the 90% confidence interval.