IBM® SPSS® Amos™ 28
Menu: Diagram→Draw Indicator Variable
When this button is in the pressed position you can perform either of two operations.
1.You can draw ellipses in the same way that  allows you to draw ellipses.
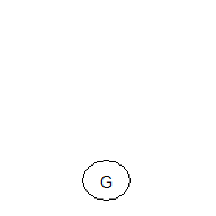
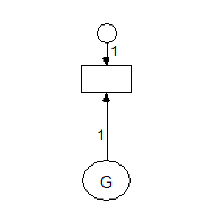
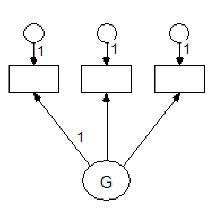
2.By clicking on an already-existing ellipse, you can add an indicator together with a unique variable. Scale constraints, necessary for model identification, will be put in place automatically. For example, clicking on the variable G in the following path diagram.

yields

Two more clicks on G give

See also:
 Reflect the indicators of a latent variable
 Rotate the indicators of a latent variable
See also:


